Here we report on the UK’s Chemical Industry with respect International Trade, Brexit and the European Single Market. Our aim is to help direct UK Chemical companies to potential opportunities in international trade, post Brexit.
Chemical Industry Overview
The Chemical Industry is the UK’s largest exporter of manufactured goods. The industry contributes £80 Million per day to the UK economy and about £195 Billion per year, as reported by the Chemistry Growth Partnership, who want to grow that to £300 Billion. Strategies for growth include rebuilding the supply chain & promoting global reach, as well as accelerating innovation and developing world-class skills. Such aspirations for growth are now more important than ever given that Brexit is looming, which itself is undoubtedly raising concerns that could hinder these aspirations.
Brexit Industry & Research Concerns
A report by Euler Hermes estimates the Chemical Industry will be the hardest hit by Brexit , if no Free Trade Agreement is reached. With potential loses of up to £7 billion, double that of the second most affected industry ( machinery and equipment, £3.5 billion). Even if a Free Trade Agreement is reached, the industry still stands to loose £2.5 billion.
The Royal Society of Chemistry (RSC) has raised concerns about the impact of Brexit on research and innovation of the UKs 2500+ Chemistry SMEs (small and medium-sized enterprises) which make up 96% of the sector, while contributing about £50 Billion to the economy. The RSC’s economic concerns don’t stop there and echo that of the industry as a whole. Loss of funding is another concern, with The EU’s 2014, “Horizon 2020“ programme providing €80 billion to research and development projects across sectors. The UK leads one fifth of all “Horizon 2020” projects (2014-2016) and is involved in 5622 in total, 32% of which involve UK companies, some case studies can be read here. Even the funding and diversity of higher education is threatened, with Chemistry departments receiving £55 million in EU funding, among the highest of all subjects. While non-UK EU nationals account for 20% of staff, 8% more than the 12% average. The Royal Society of Chemistry’s response to the Brexit white paper can be seen here and their vision of a future EU-UK science agreement here.
International Trade Post Brexit
With all the concerns and the uncertainty around our future relationship with the European Single Market, it is important that companies act now to help secure their future. Even companies without any international business are advised to be prepared and have a “to-do list“.
Preparation for the Chemical Industry is particularly important, given the volume of international trade and position as the largest exporter of manufactured goods. The proceeding analysis shows the Chemical Industries international value, identifying the UK’s largest partners as well as the World’s biggest importers, who maybe attractive for future trade relations. Analysis uses HS classification codes and concerns only those defined as “Chemical and Allied Industries“, which does not include classifications such as plastics. The European Single Market is defined as the European Economic Area (EEA) which includes the four countries of the European Free Trade Association (EFTA) in the Single Market.
Global International Trade Values
Looking at global figures, the UK was the 8th biggest exporter (£45.9 Billion) and 6th biggest Importer (£45.5 Billion) of Chemical goods world wide. The Top 10 exporters and importers, across the industry, can be seen Table1. Only 3 are currently outside the European Single Market. Extending the rank to top 20, 11 of the top 20 Importers are outside of the Single Market and 8 of the top Exporters.
Table1: Top 10 Importers/Exporters in 2016 for the Chemical Industry, HS28-38.
| Rank | Exporter | Exports (£ Billions) | Importer | Imports (£ Billions) |
|---|---|---|---|---|
| 1 | Germany | 127.4 | USA | 146.4 |
| 2 | USA | 113.5 | Germany | 90.3 |
| 3 | China | 73.3 | China | 81.0 |
| 4 | Belgium | 71.3 | Belgium | 60.9 |
| 5 | Switzerland | 69.9 | France | 47.3 |
| 6 | France | 57.9 | United Kingdom | 45.5 |
| 7 | Ireland | 54.0 | Japan | 42.3 |
| 8 | United Kingdom | 45.9 | Italy | 37.9 |
| 9 | Netherlands | 41.5 | Switzerland | 31.6 |
| 10 | Japan | 35.4 | Netherlands | 31.3 |
UK International Trade Values
In the UK, across all HS codes, the value of both exports and imports is between approximately £40-50 billion per year, with the latter being slightly lower, as shown in Figure 1. On average, since 2010, 56% of our Exports and 76% of our Imports have been inside the European Single Market (EEA) countries as shown in Figure 2.
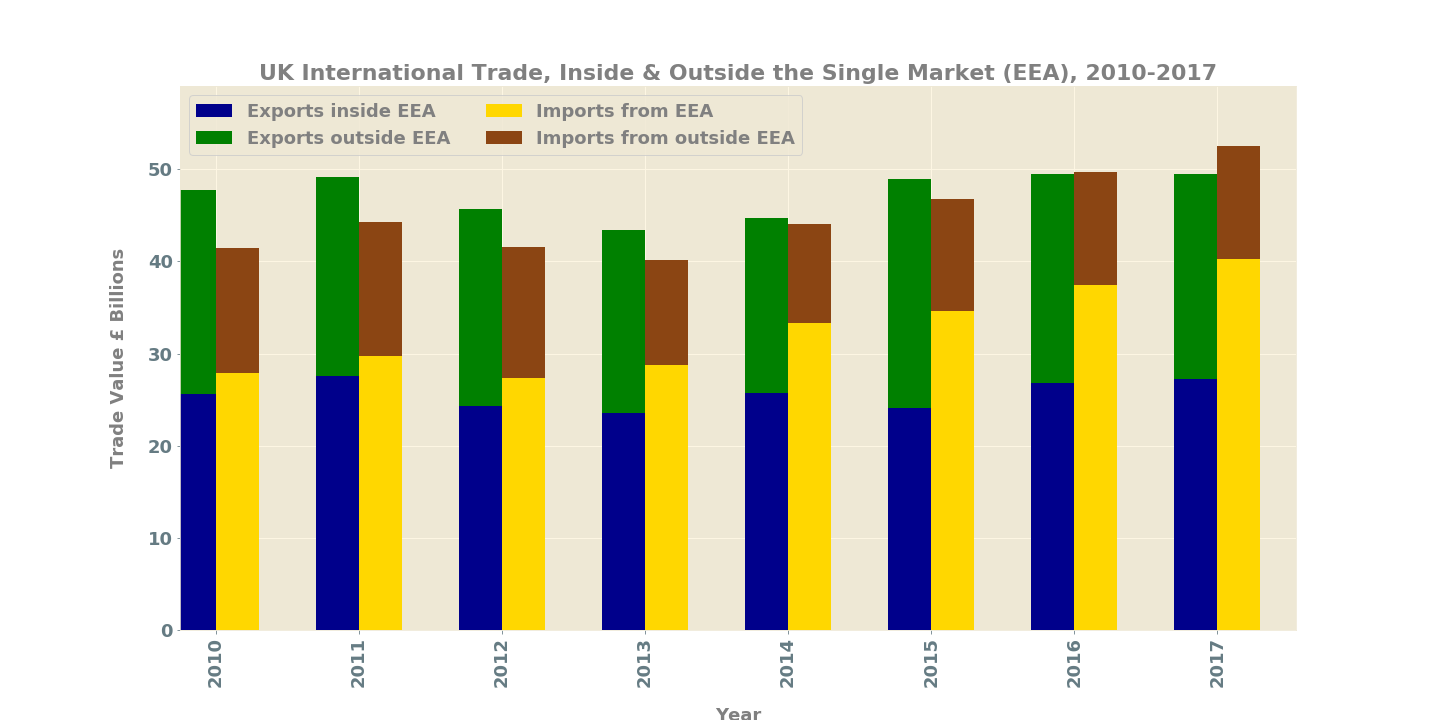
Figure 1: International trade within and outside the European Single Market (EEA). Split by flow and year.
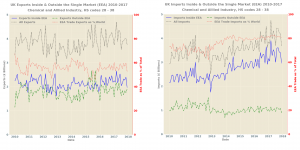
Figure 2: International trade, inside and outside the European Single Market (EEA) split by month.
UK Breakdown by HS Code
When international trade is broken down by HS commodity code, trade with the European Single Market accounts for between 51 – 71% of Exports and 51 -83% of Imports. Figure 3 shows an examples for imports and exports of HS codes 32 and 34 respectively. Plots for all classifications can be seen in the plot PDF (to be added shortly).
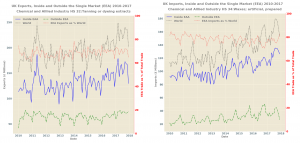
Figure 3: Examples of trade by HS codes, 32 Exports and 34 Imports respectively. European Single market (EEA) trade as a percentage of world trade plotted, on secondary y-axis, in red.
UK’s Most Important Trade Partners
Our biggest Export partners, broken down by world and inside/outside the Single Market can be seen in Figure 4. Given the analysis, trade within the single market clearly accounts for a substantial volume of the UK’s international Chemical trade, with only 2 of our top 10 trading partners (USA and China) being outside the European Single Market.
Figure 4: UK’s biggest Export Partners (i) World Wide, (ii) Inside the European Single Market (iii) Outside.

 Biggest Importers/ Potential Trade Partners
Looking at the biggest importers of chemical goods worldwide, for 2016, we see that the most attractive partners outside the European Single Market, across the industry, are: USA, China, Japan, South Korea, Canada, India, Mexico, Russia, Singapore and Australia. The figures per HS code are viewable on an interactive map, shown in screenshot below, Figure5, which plots the top 20 countries with respect to import value. Each code is represented and can be selected through the menu in the top right hand corner, all codes are selected by default . The map is zoom-able each entry has a popup that can be viewed by clicking. To view the map click here or on its picture below.
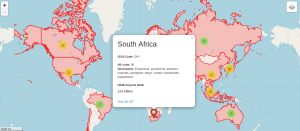
Figure 5: Picture of interactive map, click to view, opens in a new window.
More Information
Brexit will allow the formation of new trade agreements with countries outside of the EU. For company direction or more detailed information and market research enquirers please contact me on #insert add email pic. More details on the analysis can be found below.
Analysis Methodology
The source of data is the UN Comtrade website. Trade values are adjusted by monthly exchange rates, with no account for inflation. The data used is for 2010 to 2017, as the 2018 figures are not yet complete and the month of February has data missing. For global comparison 2016 data was used as 2017 was incomplete. Trade has been broken down by HS classification. The report concerns only codes defined as being in the “Chemical and Allied Industries” and so does not include classifications such as plastics, which could also be considered Chemistry. The data has been split into two groups: (1) inside the European Single market/ European Economic Area (EEA) countries, i.e. with inclusion of non EU28 countries, also known as European Free Trade Association (EFTA) countries: Switzerland, Sweden, Greenland and Lichtenstein) and (2) outside the European Single market/ European Economic Area (EEA).